What a 20-Day Moving Average Actually Tells You
Use it as a reference for trend and distance from recent prices, while watching for failed mean reversion.
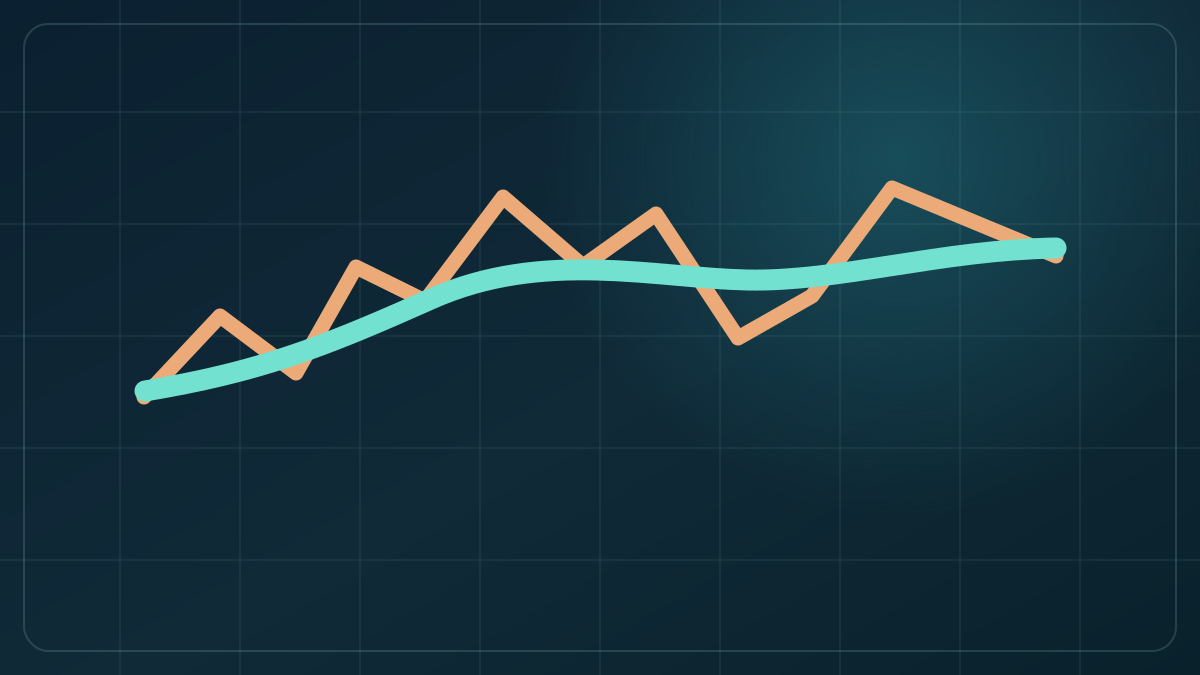
For short-duration trades, the 20-session moving average can be useful. It offers three distinct readings: direction, distance from recent prices and a possible first target for a countertrend move. Its most useful signal may be when price stops returning to it.
A moving reference, not a fair value
A 20-day moving average is the mean of the last 20 trading-session closes, recalculated every session. It smooths short-term noise. An upward slope and repeated rebounds near the line can describe an uptrend; repeated failures below it can describe weakness. None of those observations makes the next move certain.
The 2021–22 S&P 500 offers one historical example. That history illustrates the method, not a current signal. On a different security or in a different regime, the same line can behave differently.
When mean reversion is a useful hypothesis
If price has moved far from its recent average, a trader may plan for a return towards the 20-day line and use it as a first exit point. But distance alone is not a reason to enter. A strongly trending market can stay far from the average, and a moving average changes while a position is open.
The failure to return matters too
A weak rebound that turns down before touching the line suggests sellers remain in control. The converse can apply in a strong upward trend. That failure can warn against a quick mean-reversion trade. It should be tested with a defined entry, stop and holding period rather than treated as a rule that always works.
Record how often price returns to the line after a chosen distance, the time it takes and the losses when it does not. Without that record, the moving average is a visual guide rather than a measurable strategy.
Sources and notes
This article is general educational information, not personal financial advice or a recommendation to trade. Examples and chart patterns do not predict future returns. Investing and trading involve risk, including loss of capital.
Explore more Methodical Edge articles.
Browse Methodical Edge →