Four Filters for a Suspect Breakout
A practical way to question a chart break before committing capital to it.
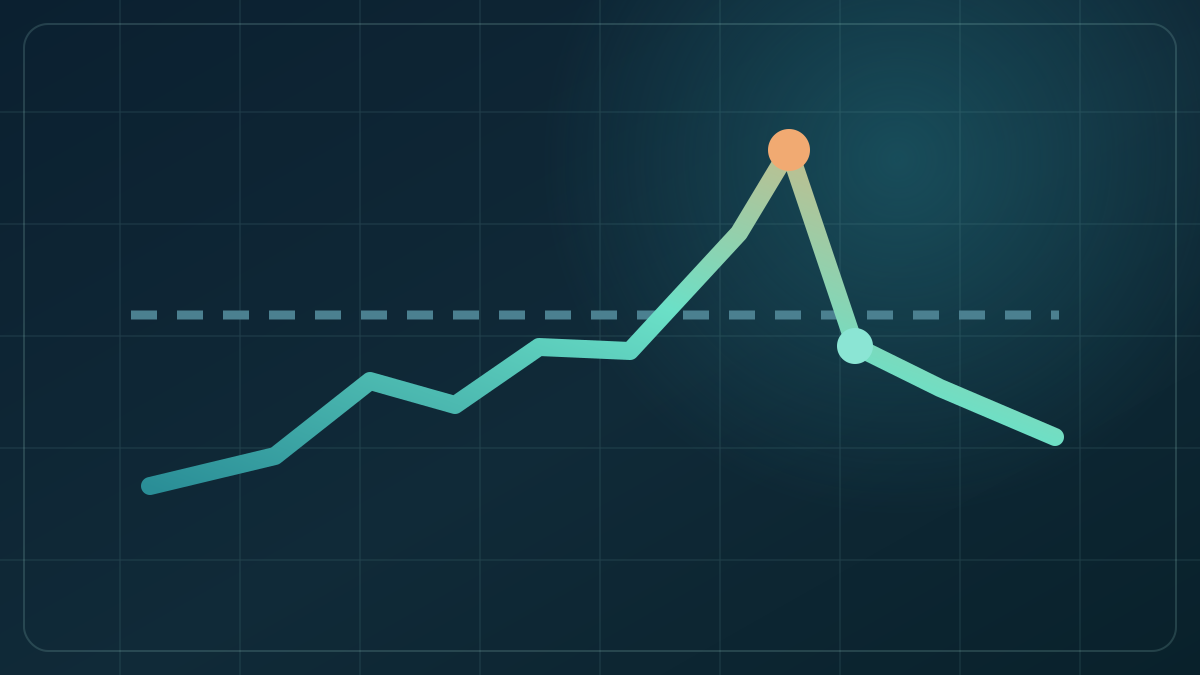
Four checks can help assess false breakouts: the larger trend, confirmation, candle behaviour and volume. None is a guarantee. Together they make a better pre-trade question than simply asking whether price crossed a line.
1. Locate the primary trend
A bullish break inside a broader downtrend is a countertrend trade. Chart examples from 2022 show how short rallies can stall even after an apparent reversal. A rate-of-change divergence may suggest selling pressure is weakening, while an oscillator can show how far the rebound has travelled. Neither signal confirms a new trend on its own.
2. Decide what confirmation costs
Waiting for a second close beyond the breakout level can screen out some one-candle moves. It can also mean entering later, at a worse price, or missing a fast move entirely. This is a trade-off. Set the rule before the event and compare its full results with a first-close entry.
3. Look for follow-through, not a single dramatic candle
A breakout followed by immediate selling, a long upper wick or a close back inside the prior range weakens the case. A red candle alone does not invalidate every bullish setup; location, size and the next candle matter. Conversely, a breakdown that fails to make a new low can be a warning to shorts.
4. Compare volume with the normal baseline
Volume can be a fourth filter, but only if its rule is defined in advance. Ask whether participation was unusually high or low relative to comparable sessions, and test that condition before assigning it a success rate.
Sources and notes
This article is general educational information, not personal financial advice or a recommendation to trade. Examples and chart patterns do not predict future returns. Investing and trading involve risk, including loss of capital.
Explore more Methodical Edge articles.
Browse Methodical Edge →